Experimentation is in active development. Naming, scope, and behaviour may change before general availability. The draft PR is the place for feedback.
Screenshot placeholder — Hero image — wide shot of the Experiment Results dashboard with lift bars and the recommendation callout. Target path:
/img/experimentation/hero-results-dashboard.png
Experimentation (A/B Testing)
Overview
Flagsmith Experimentation lets you run controlled A/B tests on your multivariate feature flags. Metrics are computed from your data warehouse, and results are read inside Flagsmith.
This guide covers three flows:
- Connect a data warehouse — one-time organisation-level setup so Flagsmith can compute metric values.
- Create an experiment — a 5-step wizard for hypothesis, flag, metrics, audience, and traffic split.
- Read experiment results — summary cards, recommendation, metrics comparison, and trend chart.
Experimentation builds on three Flagsmith concepts:
- Multivariate flags. Every experiment runs on one. Existing variations become control and treatment.
- Segments. Define the audience. Users outside the segment see the flag's environment default.
- Identities. Users are bucketed by identity, the same way multivariate values are assigned today. A user keeps their variation for the duration of the run.
Prerequisites
A connected data warehouse. See Data Warehouse Integration for setup. The connection is organisation-scoped, so configure it once per organisation and every project picks it up.
Creating an experiment
Experiments have their own page in the project sidebar, alongside Features, Segments, and Identities. Both creating and reading experiments start here.
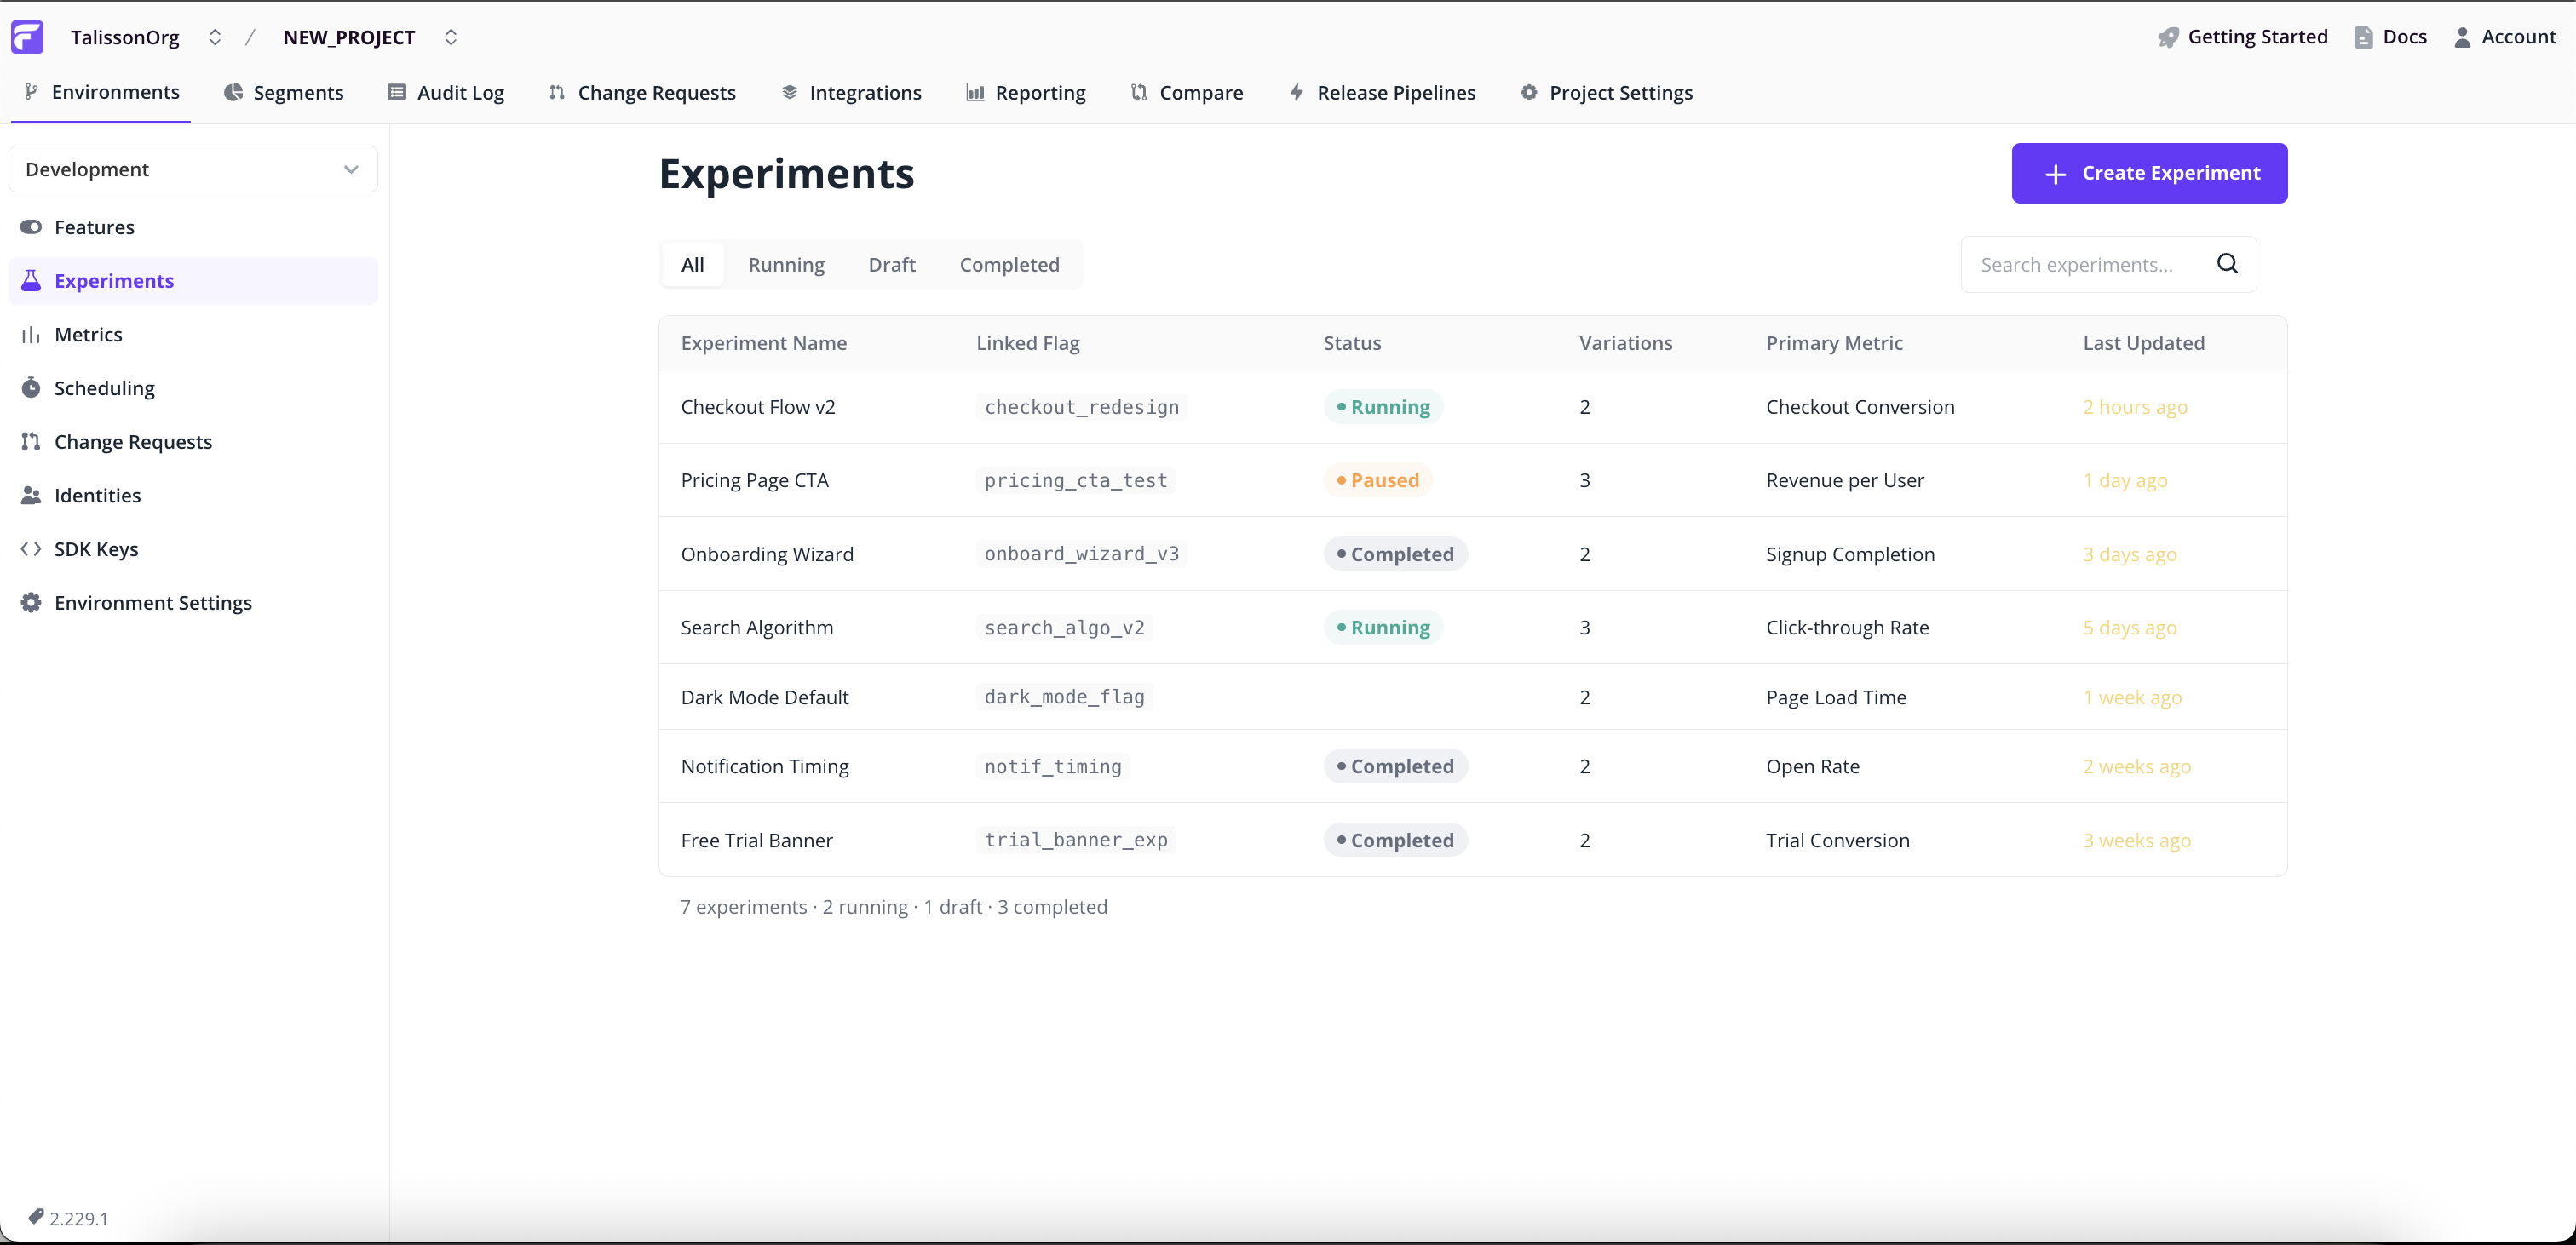
Click Create Experiment in the top right to open the 5-step wizard. Each step validates before the next; jump back from the Review & Launch summary at any time.
Experiment Details
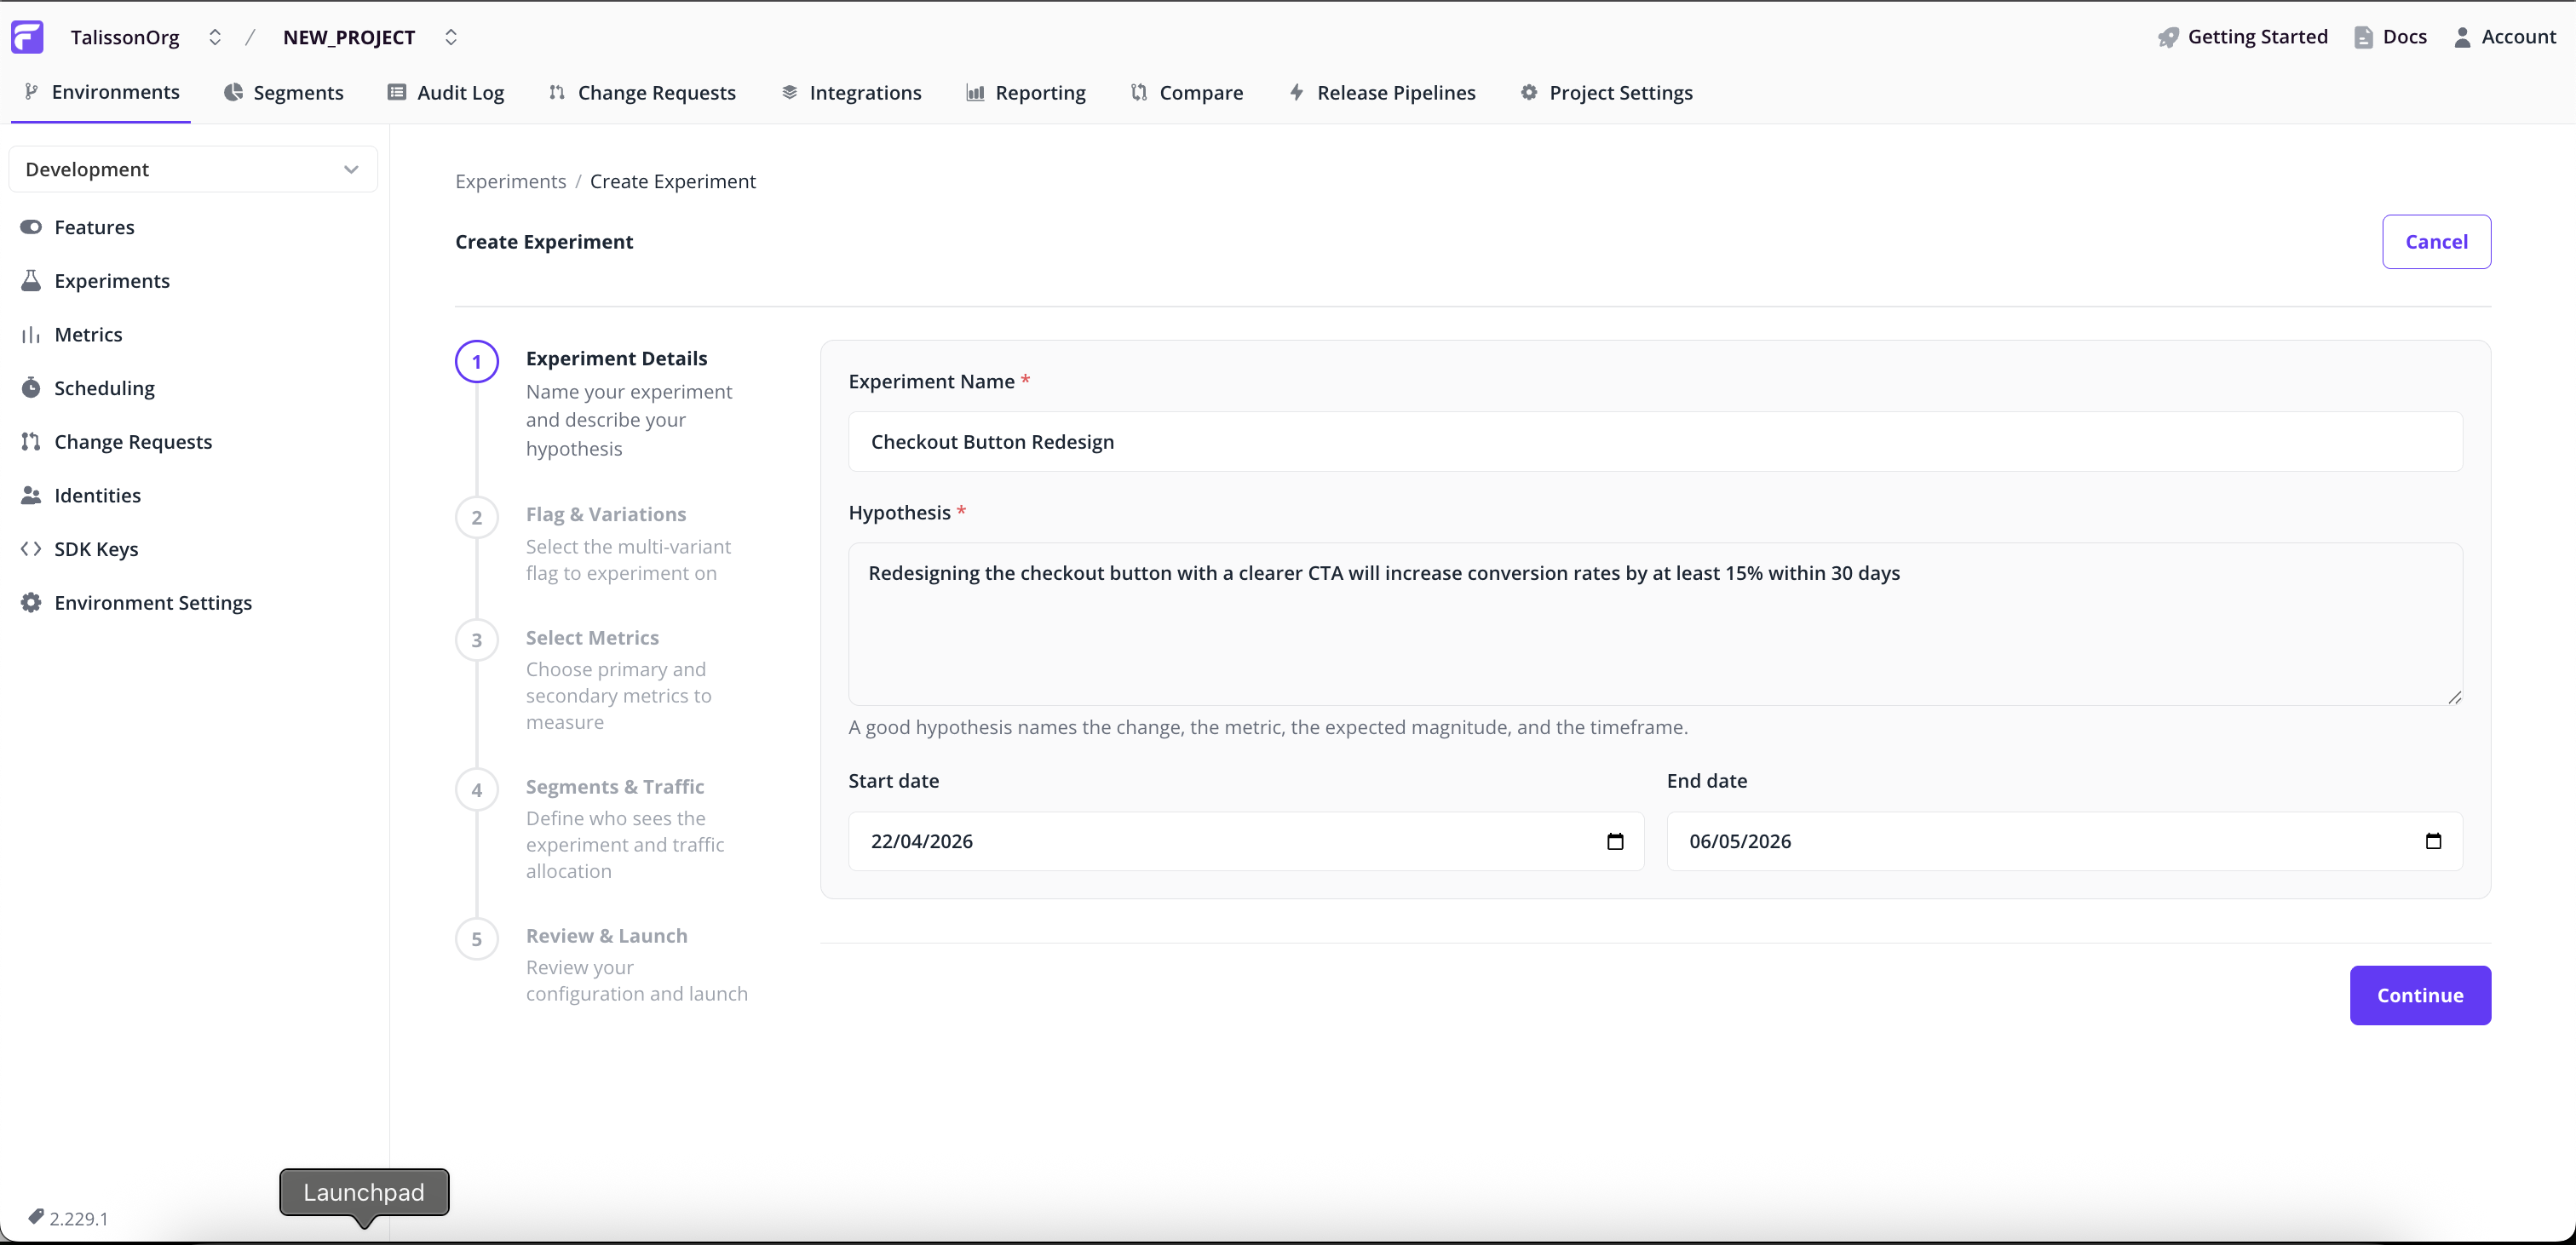
- Name. A short identifier, e.g.
checkout_paypal_button_test. - Hypothesis (required). What you expect to happen, and why. This stays attached to the experiment after launch, so the original intent is still visible later.
- Start and end dates. Default to today plus 14 days. Change them to schedule for later or run a longer window.
Flag & Variations
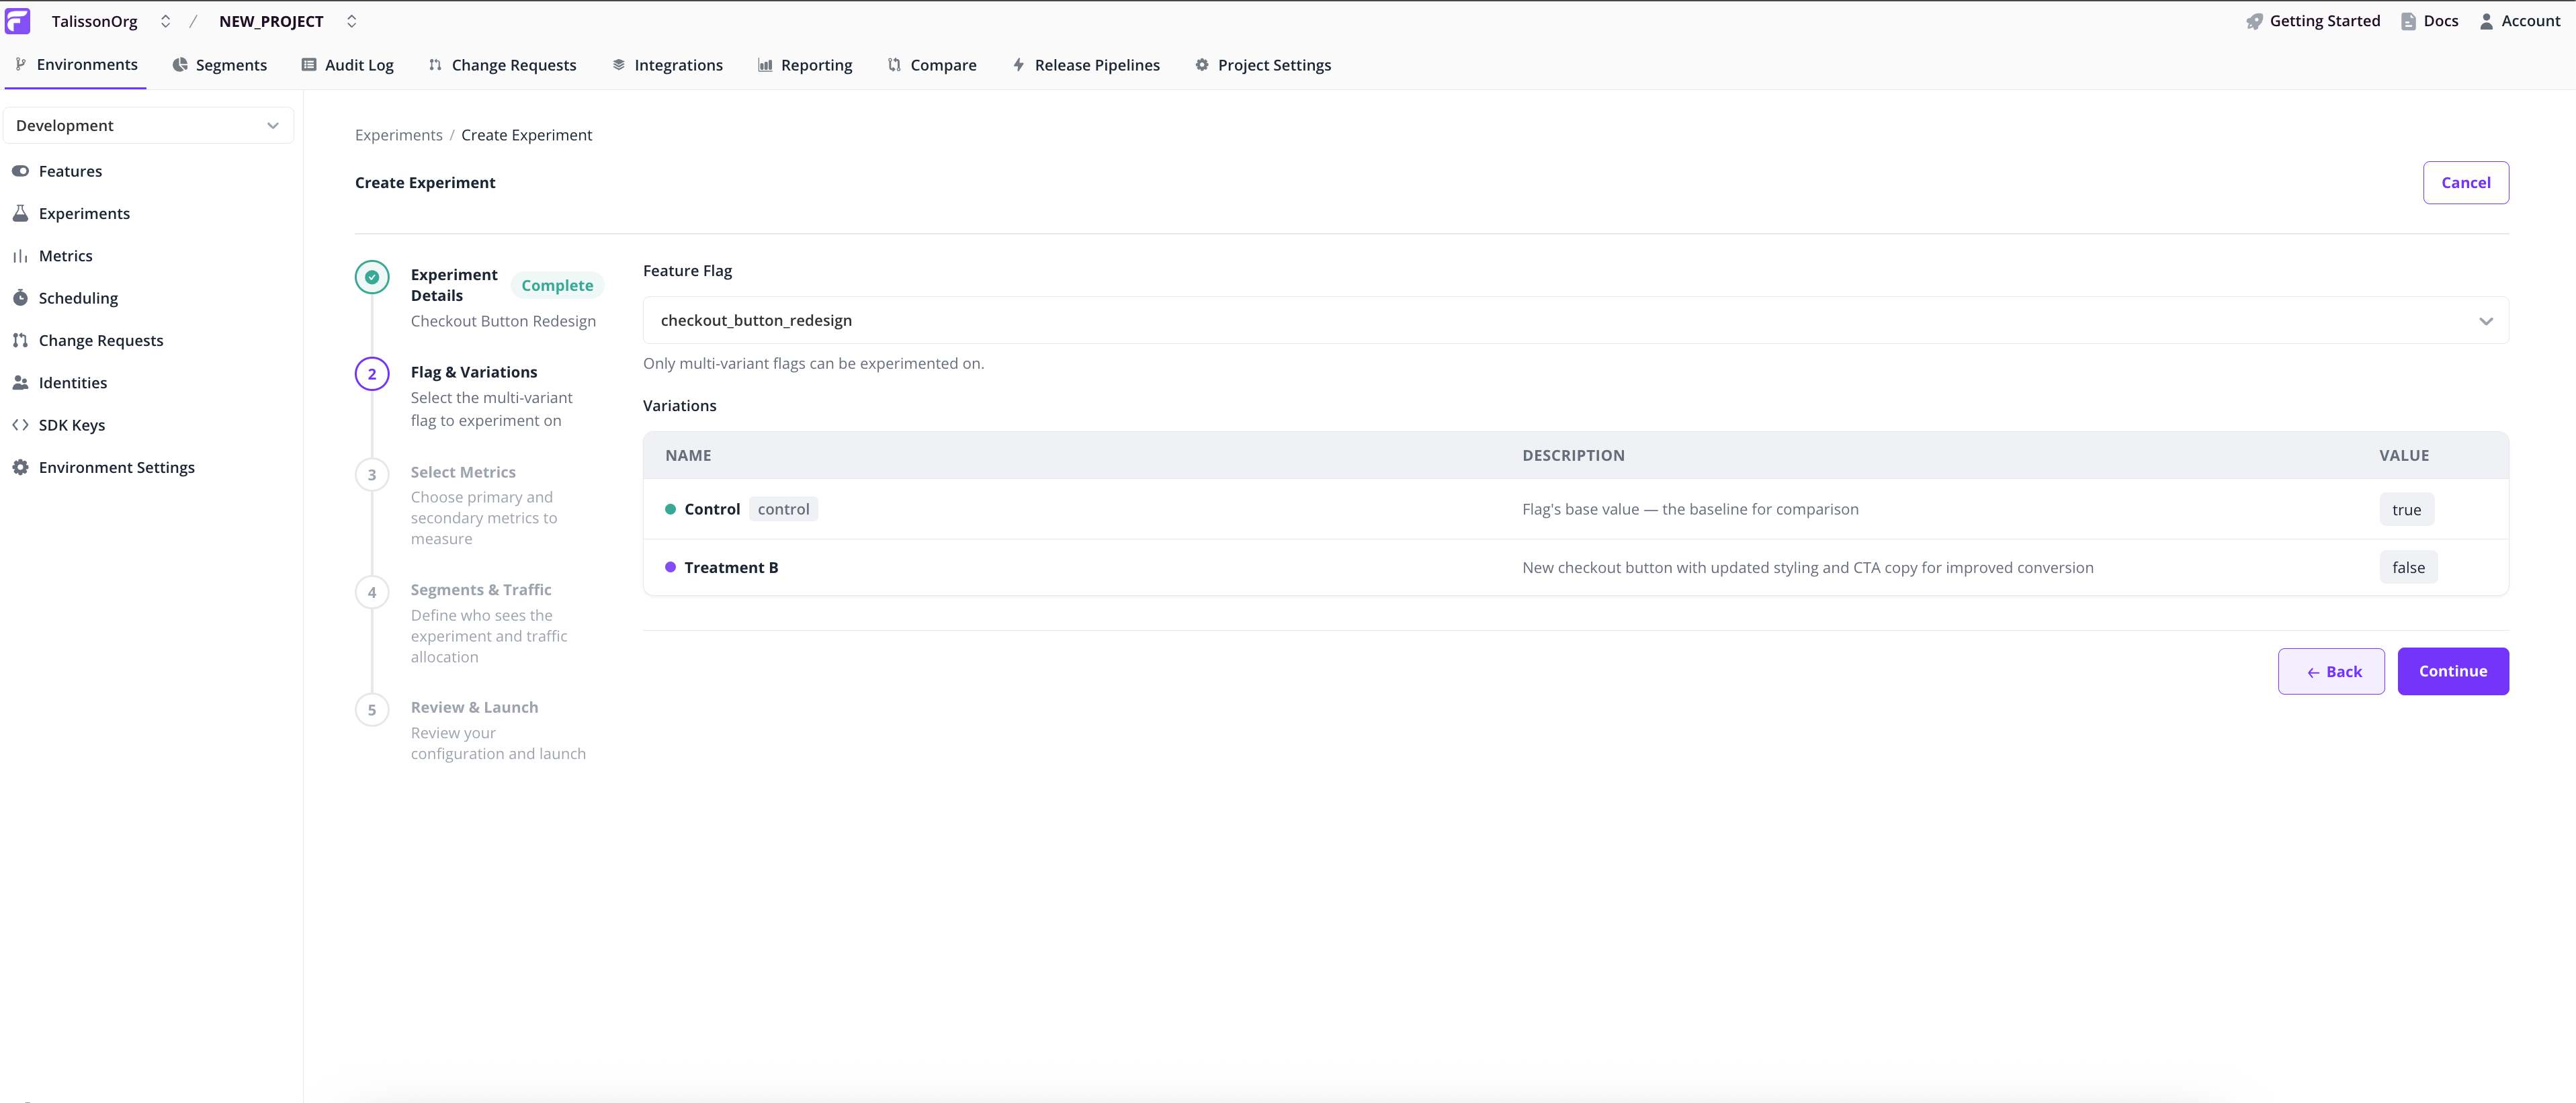
Pick the multivariate flag to experiment on. The Variations table shows the flag's existing values, which become the experiment's control and treatment.
Single-variant flags aren't eligible. The wizard blocks them and links to the flag's page so you can add a variation.
Note: Experiments need at least one non-control variation. If the flag doesn't have one, the wizard points you to the flag's main page to add it.
Select Metrics
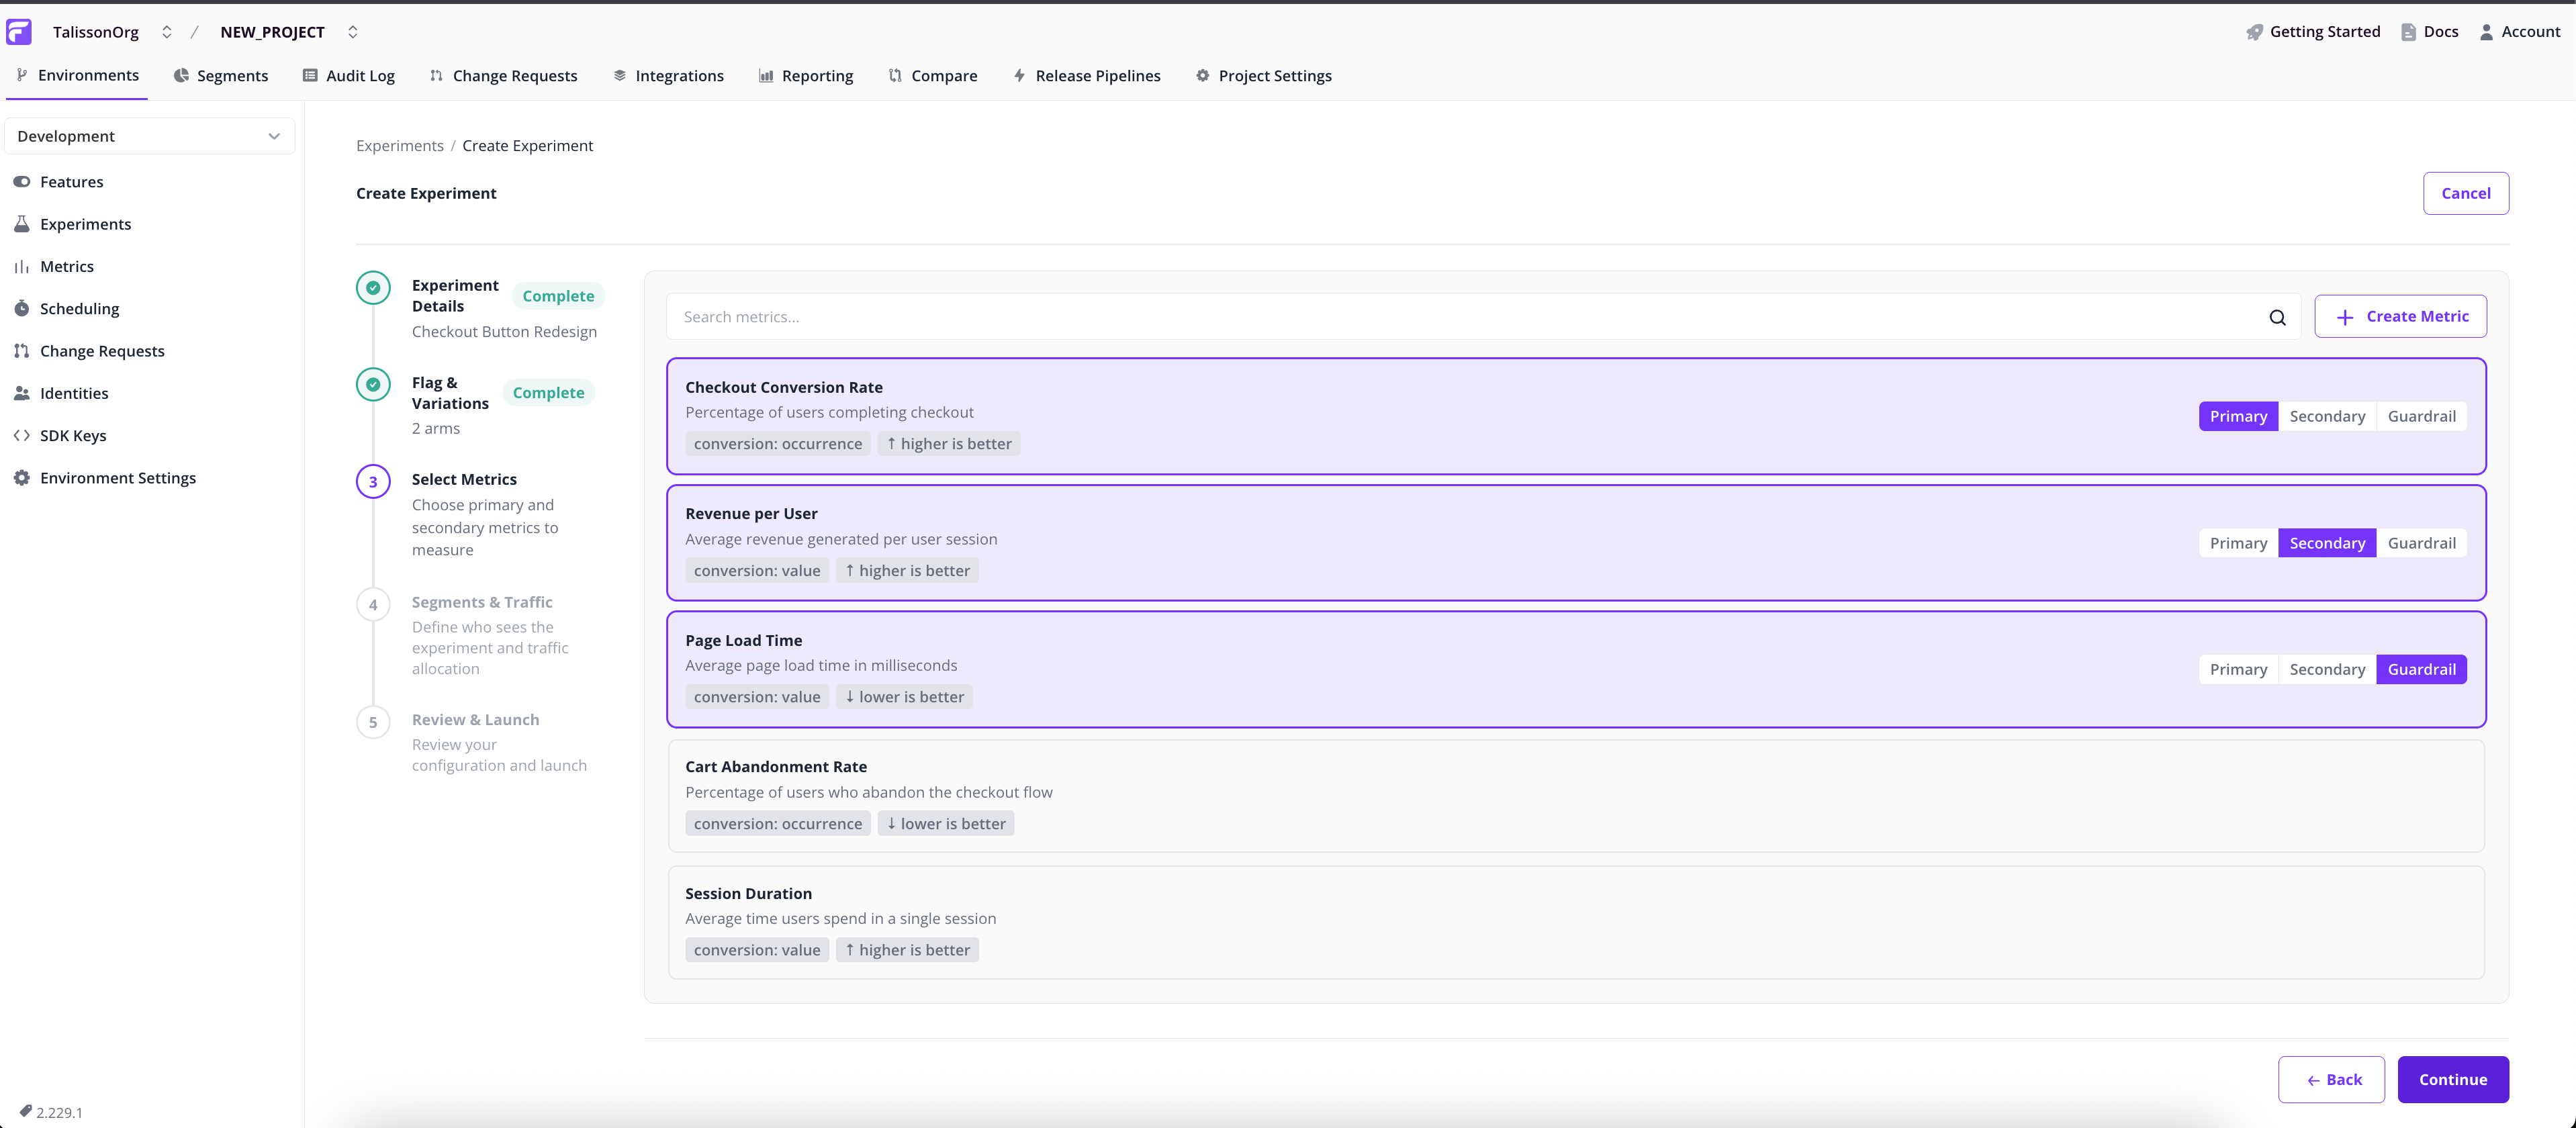
Select the metrics this experiment will track. Each metric has a role:
- Primary. Drives the verdict. The experiment succeeds or fails based on significance here.
- Secondary. Tracked alongside primary metrics, but doesn't influence the recommendation.
- Guardrail. A safety check for metrics you don't want to break, such as page-load time or error rate.
Pick a role for each metric with the three-way segmented control. Multiple primaries are allowed but harder to interpret statistically; the wizard warns you if you select more than one.
Segments & Traffic
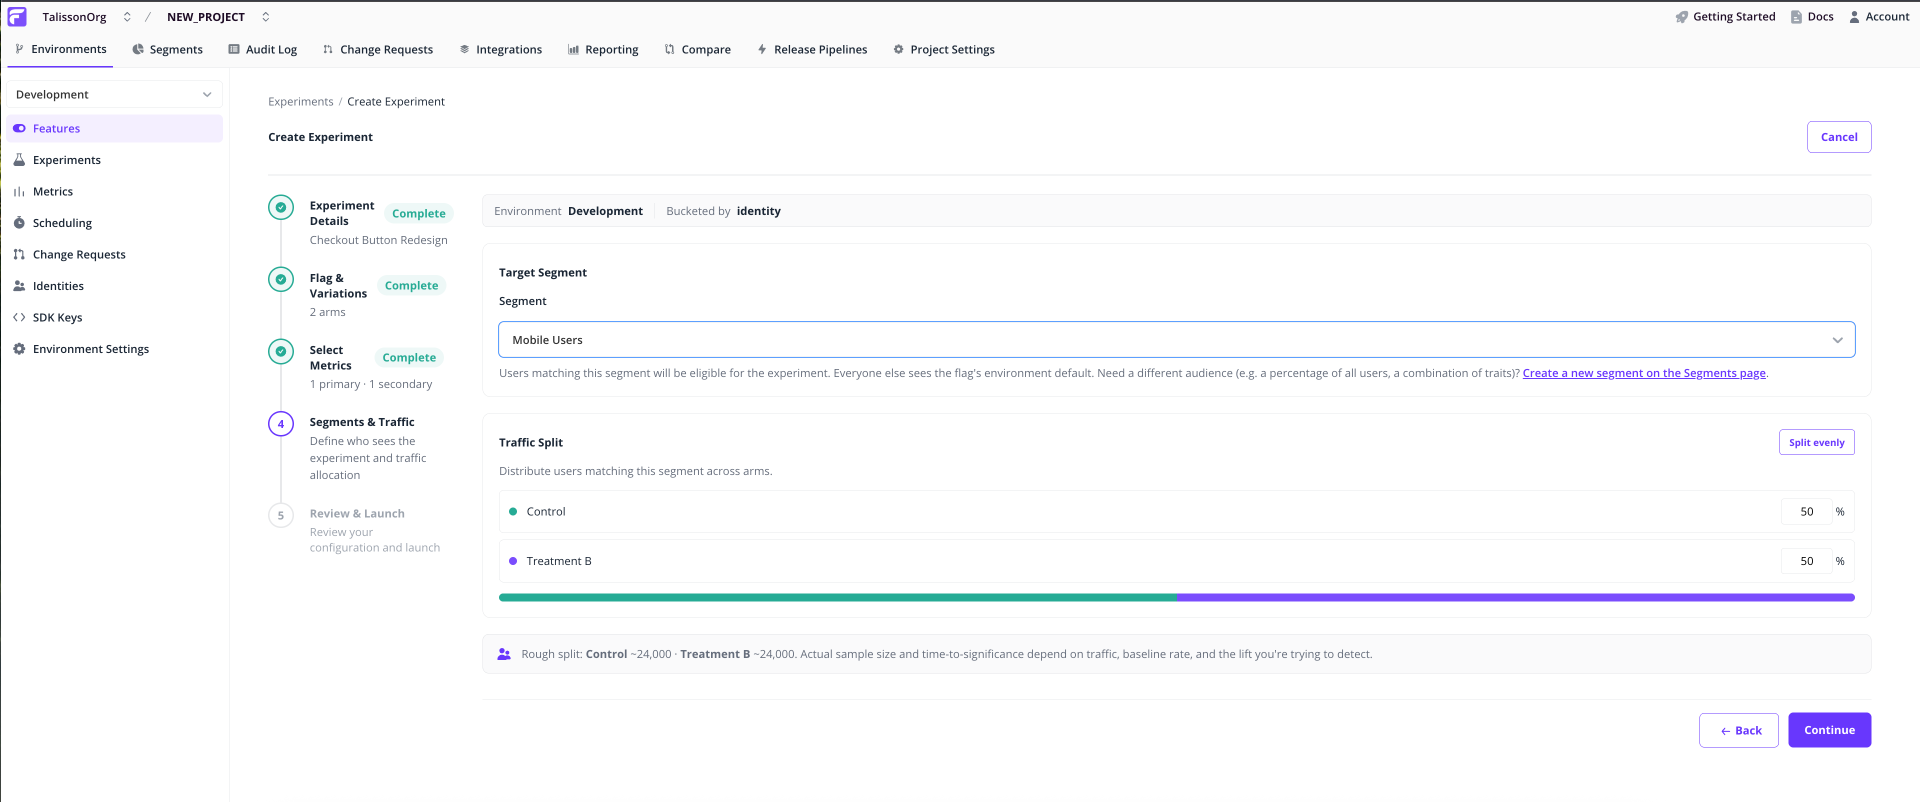
Pick the segment of users who'll be eligible. Users outside the segment keep the flag's environment default.
Set traffic weights: the percentage of eligible users assigned to each variation. Weights auto-balance, so adjusting one rebalances the others. Click Split evenly to reset.
If the flag already has an override for the chosen segment, the wizard blocks you with a conflict banner. Pick a different segment or remove the override before continuing. A live experiment on a segment with an override produces incorrect assignment.
Review & Launch
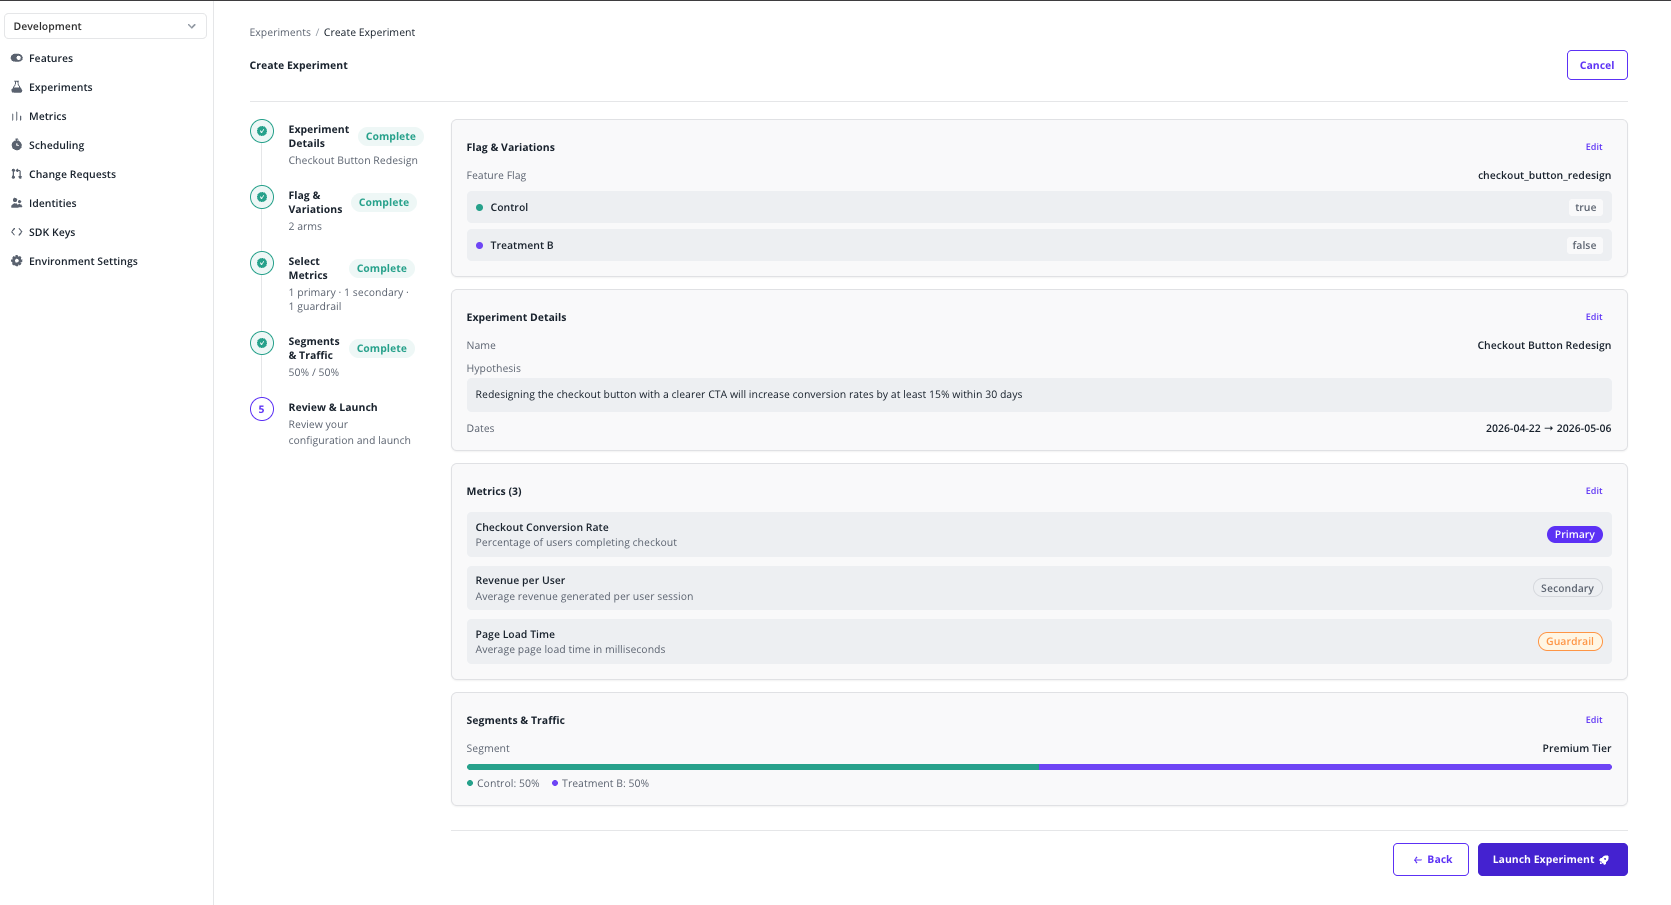
Read through the summary, edit any section by clicking its Edit link, then click Launch Experiment and confirm.
Traffic assignment starts immediately. The flag begins serving the configured weights to users in the chosen segment.
Note: Once launched, the configuration is locked for the rest of the run to keep the result statistically valid. To change anything, stop the experiment and start a new one.
Reading experiment results
Click any running or completed experiment from the Experiments list to open its Results dashboard.
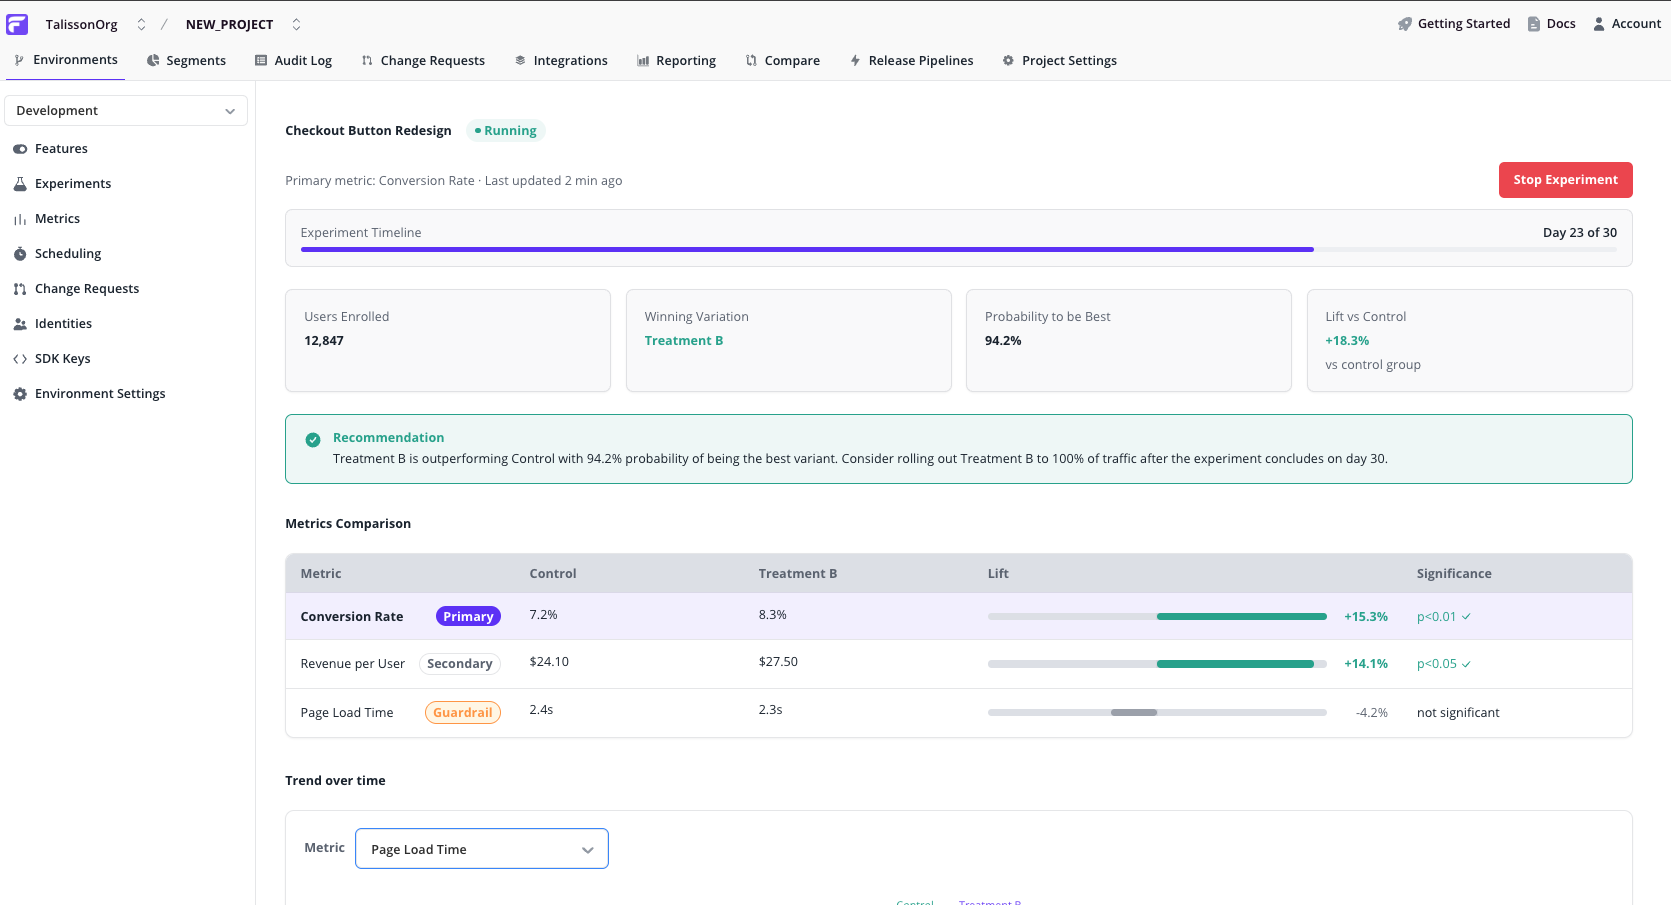
Summary cards
- Lift vs. control on the primary metric.
- Probability of being best. Confidence that the leading variation actually wins.
- Sample size per variation. How many assigned identities have contributed data so far.
Recommendation callout
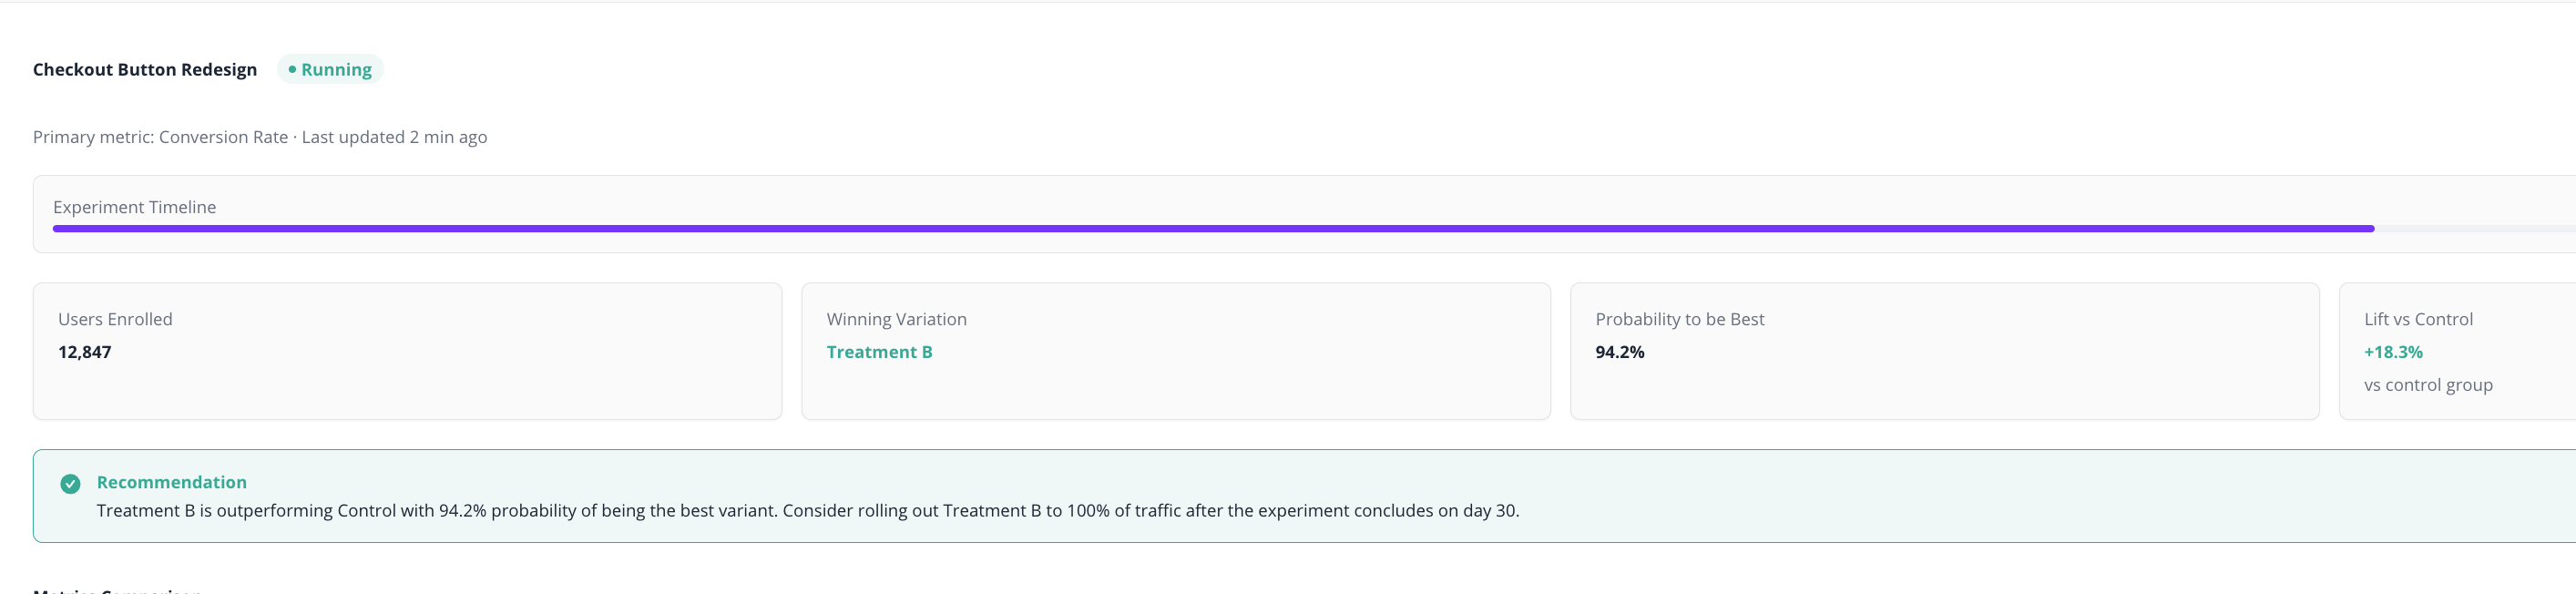
A plain-language summary: which variation is leading, how confident the verdict is, and what to do next (keep running, declare a winner, or investigate).
Metrics comparison table
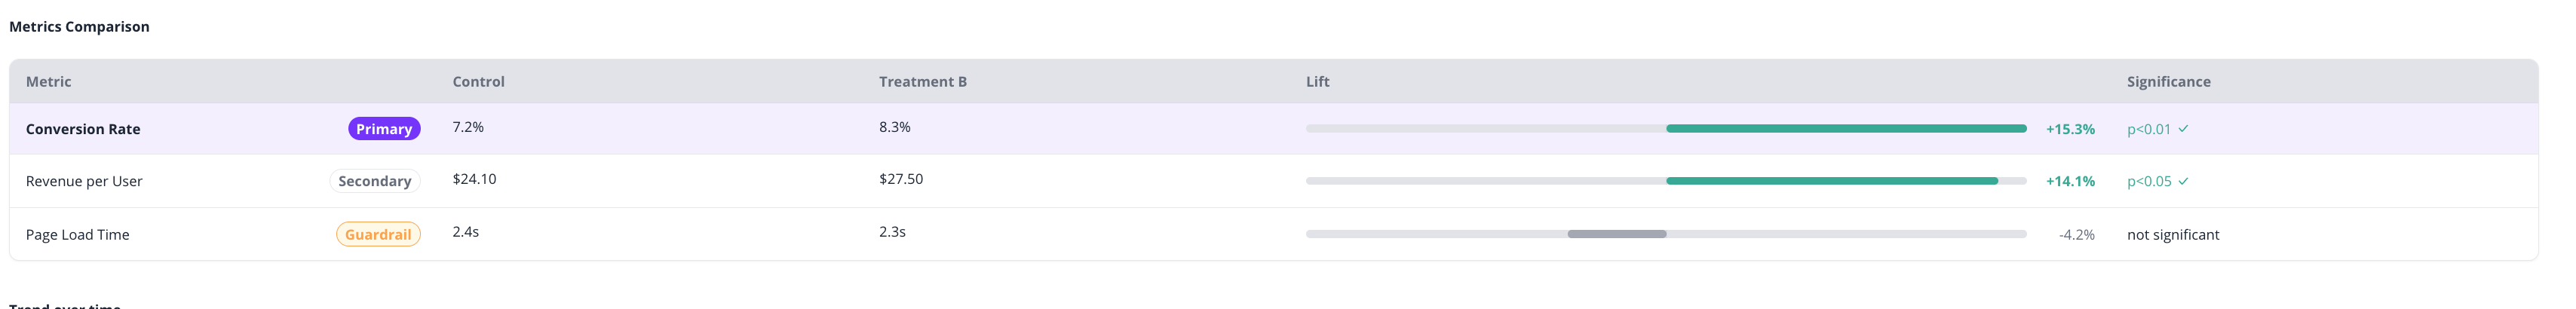
One row per metric, with the primary row visually emphasised. Each row shows:
- Role badge. Primary, Secondary, or Guardrail.
- Control value and Treatment value.
- Lift bar. Zero-centred, showing the relative change and its direction.
- Significance. Statistical confidence in the observed lift.
Trend over time
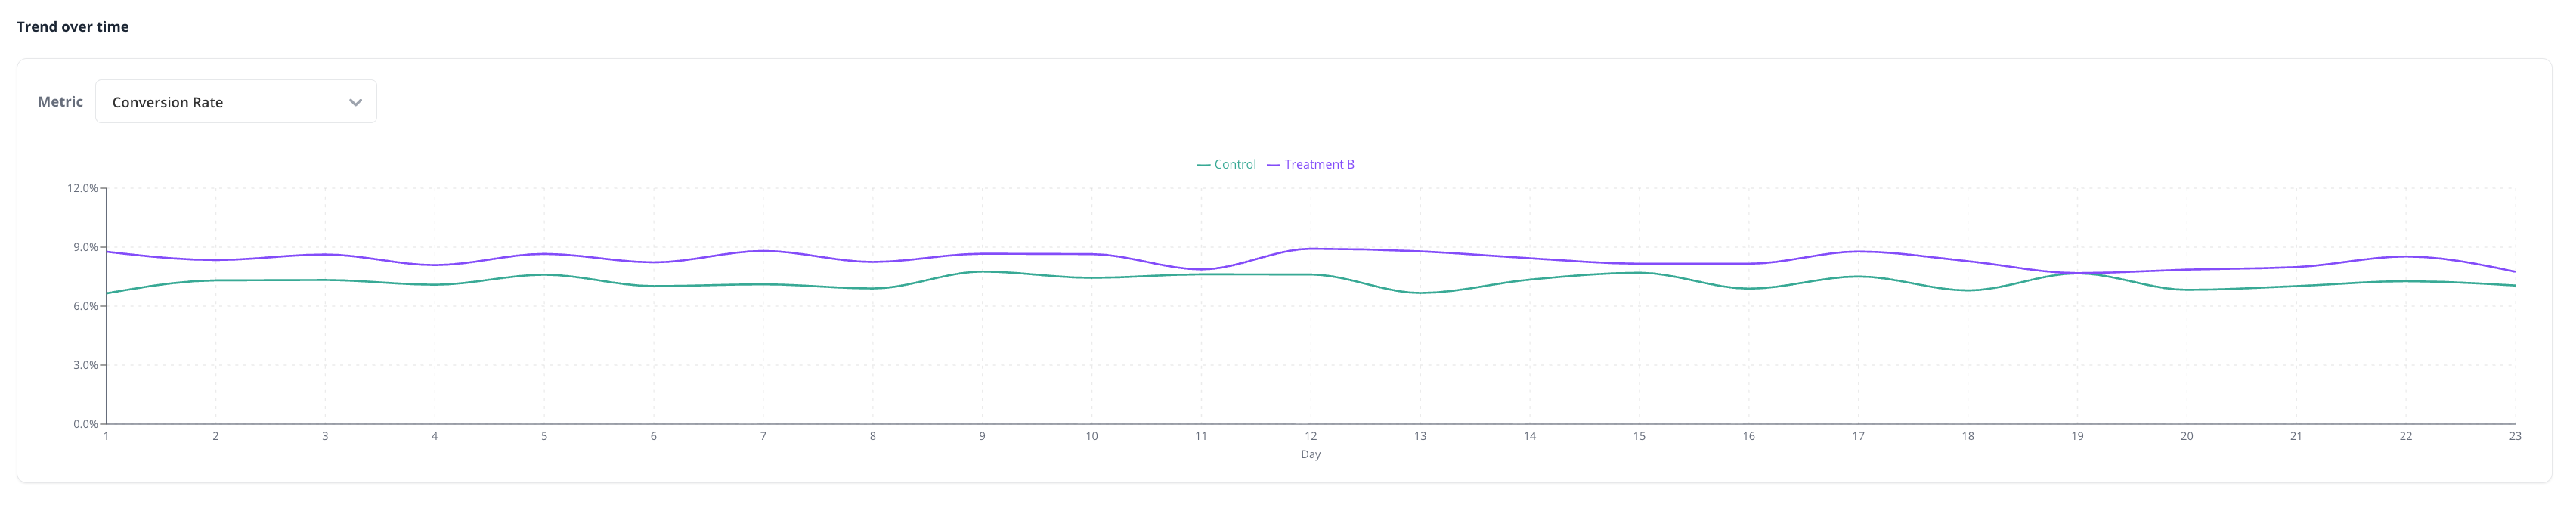
A line chart plots each variation's value over the experiment's run. Use the metric selector above the chart to switch between metrics.
Look for stability. Lines separated for several days are more trustworthy than ones that crossed yesterday.
What's next
- Multivariate flags. The building block under every experiment.
- Segments. Define an experiment's audience.
- Identities. The unit Flagsmith buckets users by.